Scientific Computing · Mar–May 2026
Tensile Analysis Platform
Turning raw laboratory spreadsheets into reproducible stress–strain analysis and material property calculations.
Overview
Making laboratory measurements easier to understand
A tensile-testing machine records how a material responds as it is stretched. Turning those readings into useful comparisons involves more than plotting a curve: spreadsheets need to be connected to specimens, relevant properties calculated, and differences between groups interpreted.
I built this Streamlit dashboard for a University of Stuttgart research laboratory to bring those steps into one workflow. It combines raw-data handling, stress–strain analysis, material-property calculations, and comparison tools.
How it led to Aevrilo
The dashboard exposed the importance of keeping calculations connected to their inputs and interpretation. That experience inspired Aevrilo, a new implementation organised around explicit geometry, saved analyses, scoped reviews, and portable experiments.
The two projects represent different stages of the work. The laboratory history of this dashboard does not imply that Aevrilo has already received the same validation.
Technical detail
Pandas handles laboratory spreadsheets, with fuzzy-token matching used to connect inconsistently named records to raw measurements. SciPy supports numerical and statistical analysis.
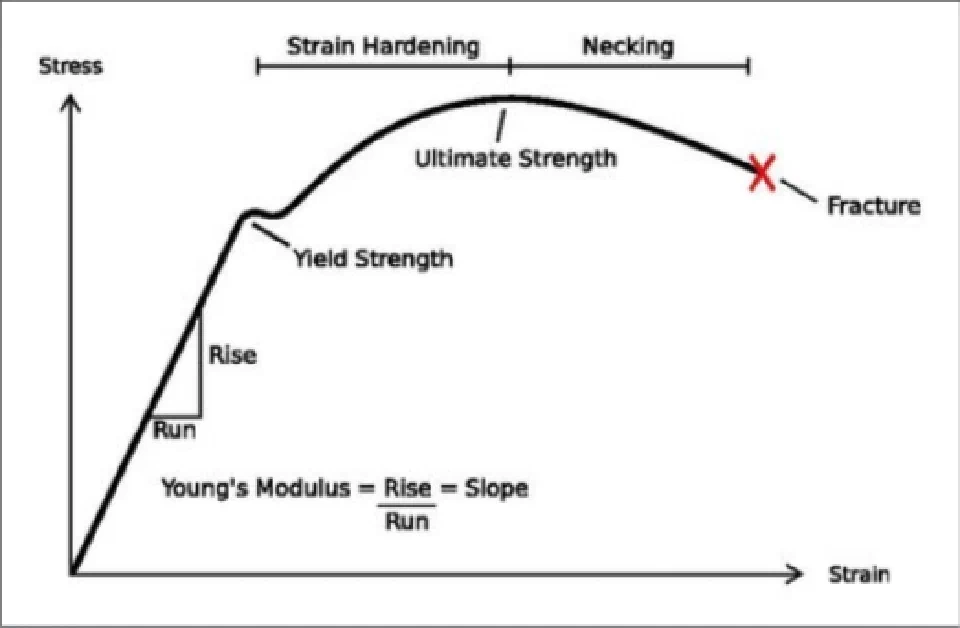
A Young’s modulus window-search engine uses cumulative-sum statistics to find candidate linear regions rather than fitting the entire stress–strain curve. A 0.2% offset calculation supports yield-strength estimation. ANOVA, t-tests, and IQR outlier detection support comparisons between material groups.
The Streamlit interface brings those numerical operations together with interactive inspection and comparison. The challenge is preserving the meaning of each calculation while making the workflow usable to researchers.